
DC Decoded
$3 Trillion in Data Centers by 2030
A plain-language guide to why data centres are measured in power, what a gigawatt means and where the enormous investment requirement comes from.
All figures sourced from JLL 2026 Global Data Center Outlook, Lawrence Berkeley National Lab 2024, and Fortune Aug 2025
When I started writing about data centers, I assumed most people in my network had a rough sense of how the industry works. Then the responses came in. The most common one was some version of: “I know this is a big deal, but I genuinely don’t understand what a gigawatt is or why it matters.”
Fair. I spent years working in this industry and I still had to look some of this up properly. So let me explain it the way I wish someone had explained it to me, no jargon, just the actual picture.
Why data centers are measured in power, not space
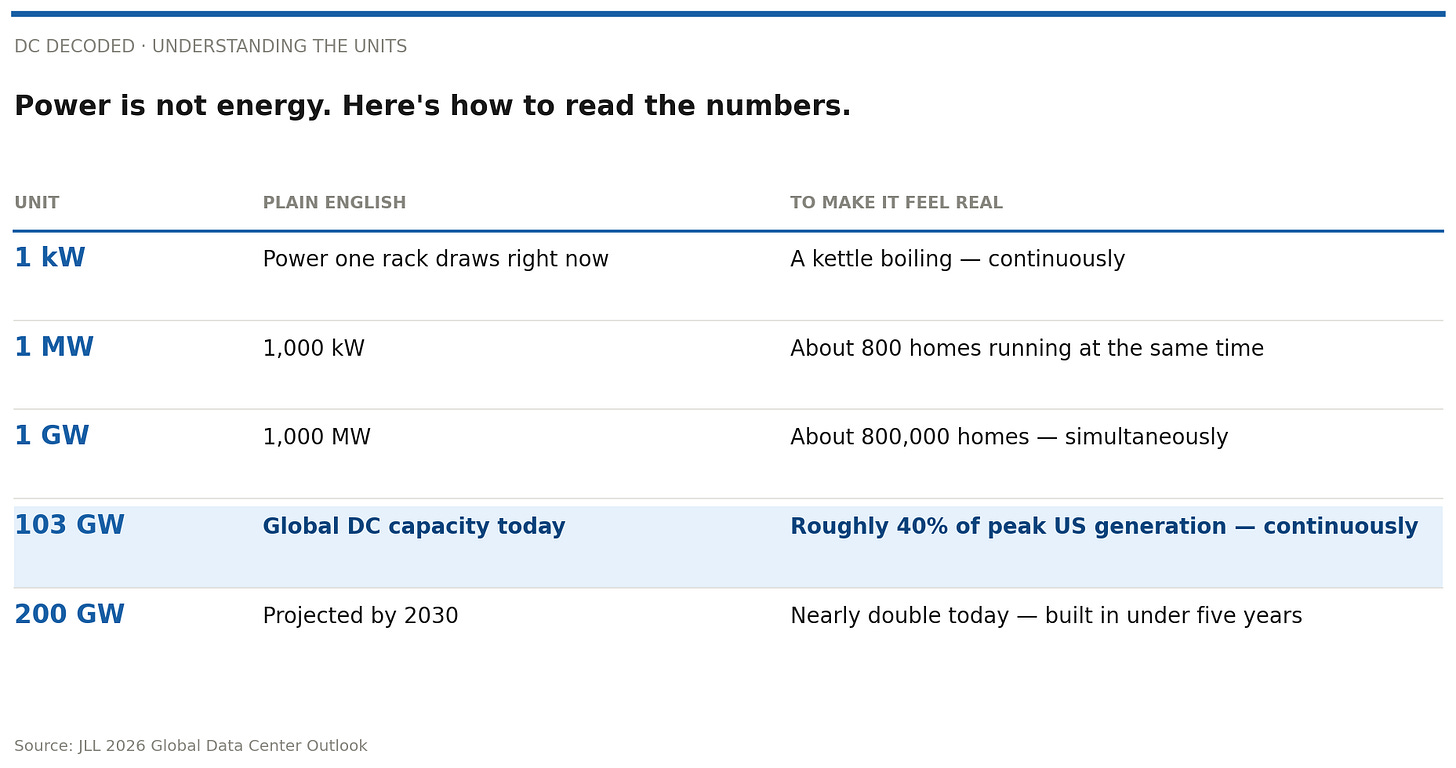
Most people picture a data center as a big building full of servers. That’s not wrong but it leads to the wrong question. The question most people ask is: how big is it? The question the industry actually asks is: how much power can it draw?
The reason is simple. You can always put more servers in a building. You can’t always get more electricity to run them. Power is the real constraint. Which is why the industry measures capacity in megawatts (MW) and gigawatts (GW) not square metres.
Here’s the part that trips most people up: power and energy are not the same thing.
Power is how much electricity is flowing right now. Think of it as a pipe the width of the pipe determines how much can flow at any moment. Energy is what you get when power flows over time the total water that passed through the pipe. Your electricity bill measures energy. A data center’s capacity is measured in power.
So when someone says a data center has 100 MW of capacity, they mean: at full load, that facility can draw 100 megawatts from the grid continuously right now, at this moment, for as long as it’s running. Not a tank that empties. A pipe that stays open.
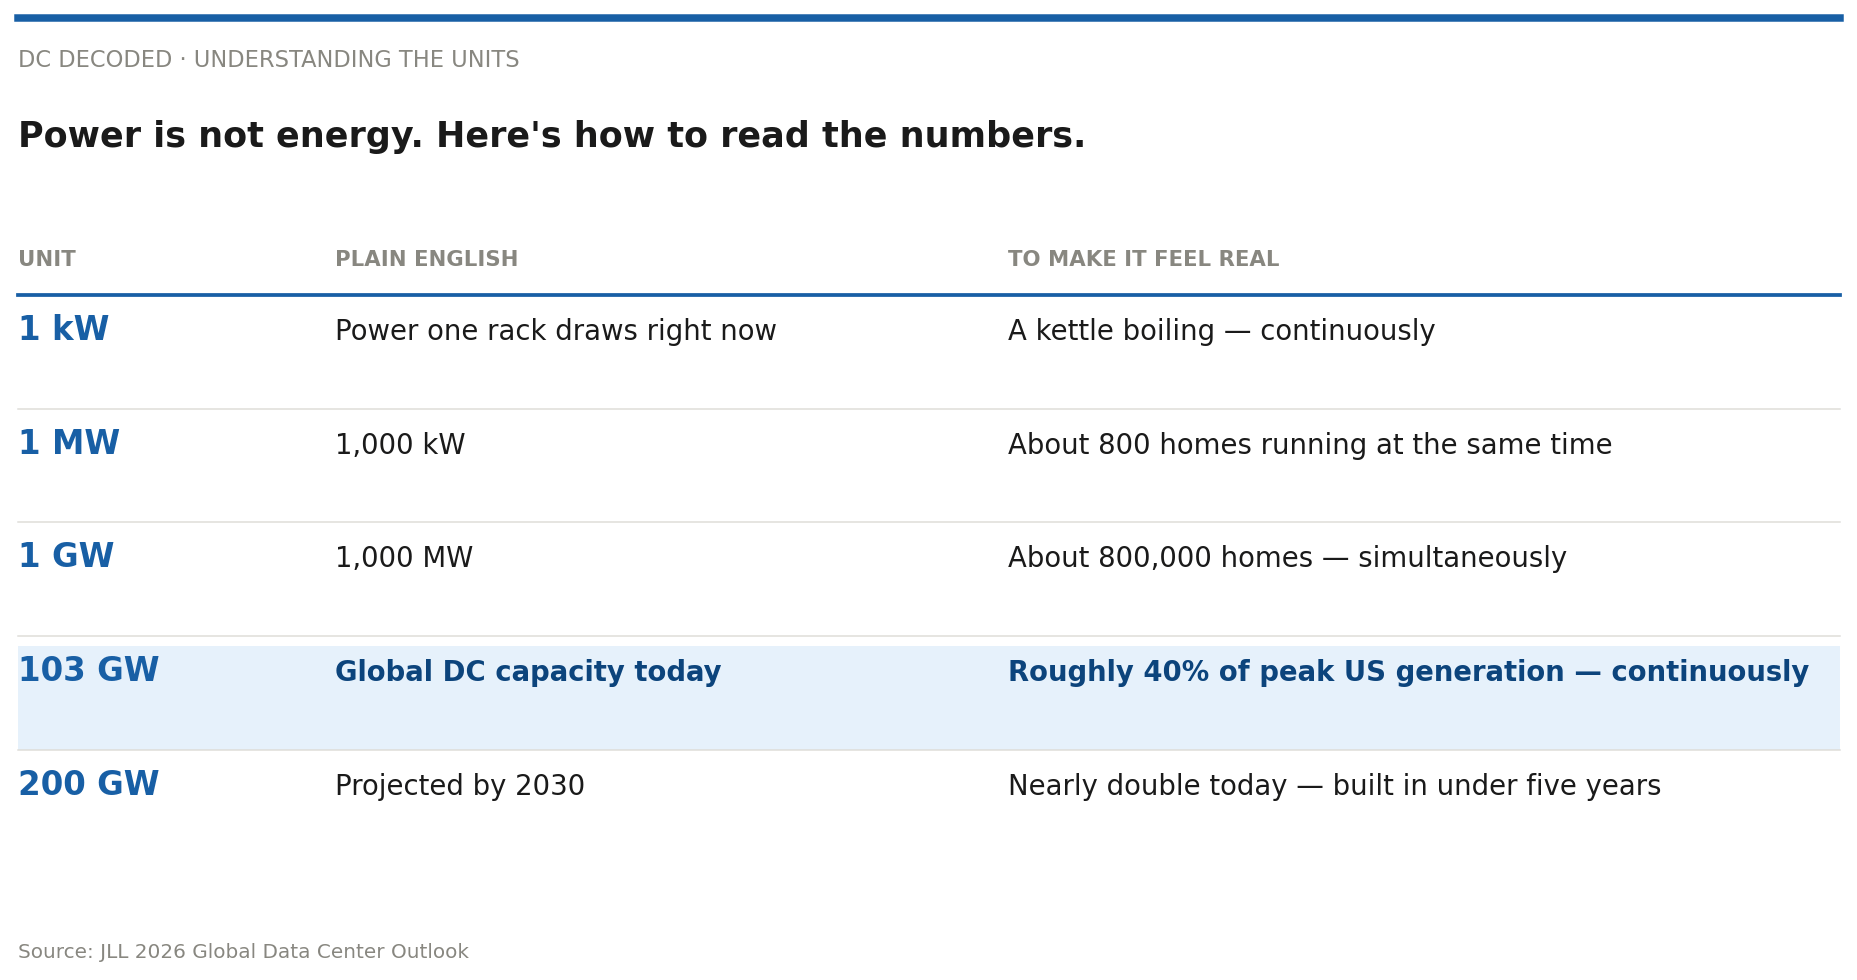
That last number 103 GW today, 200 GW by 2030 is not a forecast someone made up. That’s where the signed leases, the construction starts, and the capital commitments currently point. And it will require around $3 trillion in total investment to get there.
Where is it all being built?
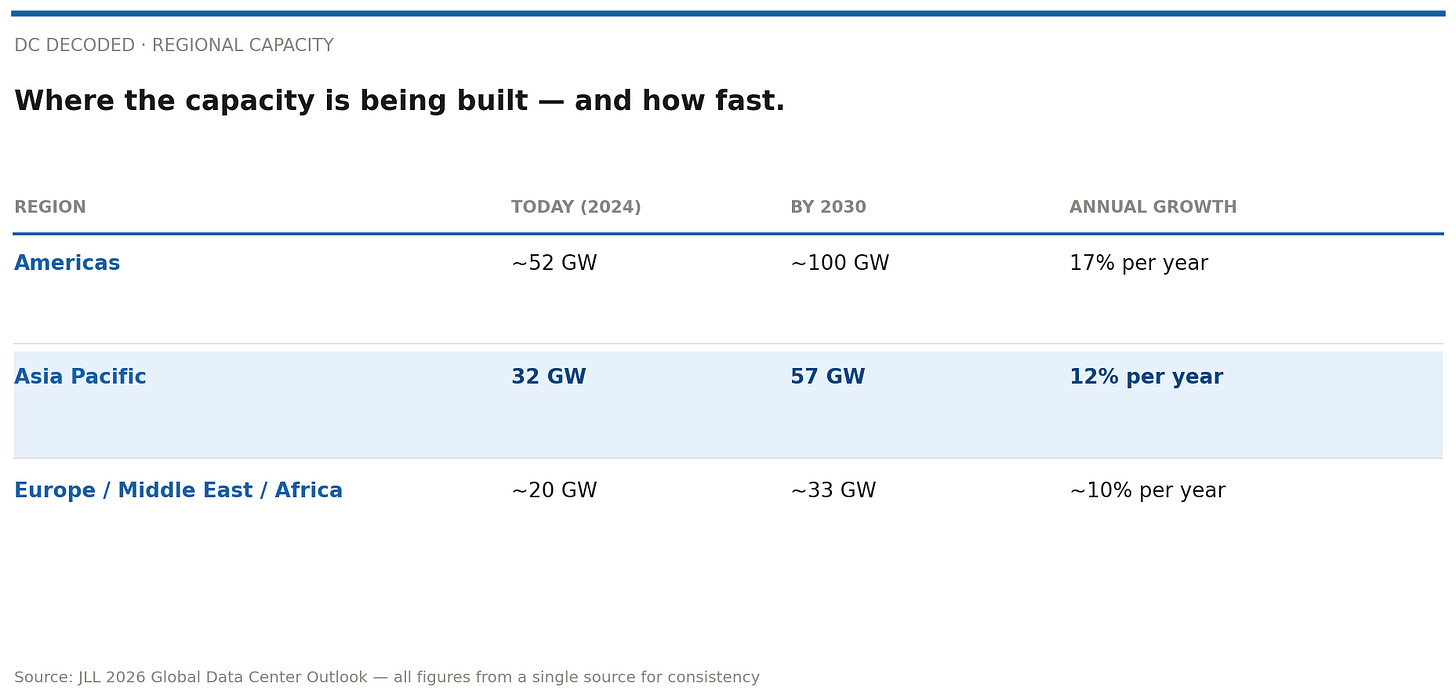
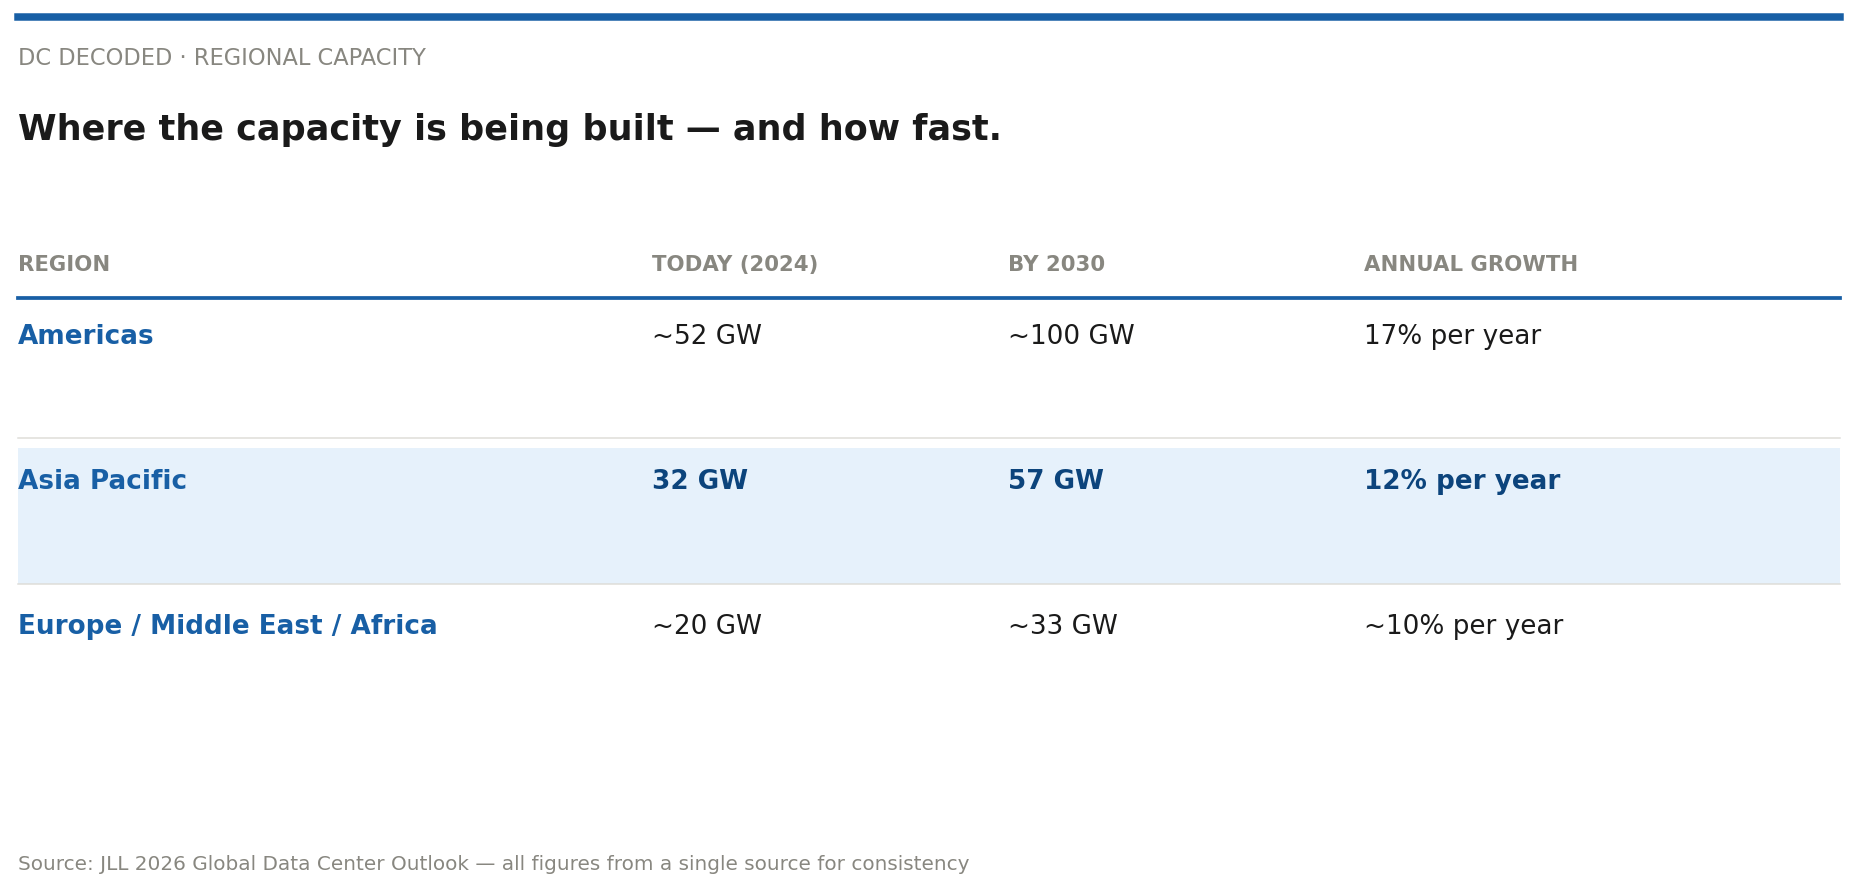
The Americas dominate roughly half of global capacity today, growing at 17% per year through 2030. The US drives most of that. The grid is more accessible than most markets, regulation is workable, and the companies behind most of the demand are American.
Asia Pacific is the more interesting story for me personally. I spent years working in Singapore, Malaysia, and India watching this industry from the inside. The region is at 32 GW today and is projected to reach 57 GW by 2030. That sounds like a clean growth story. On the ground it’s messier Singapore hit grid limits and paused new permits, Malaysia moved fast to fill the gap, India is building at a pace the grid isn’t fully ready to support. The number is real. The path to get there is complicated.
Three things slowing it all down
The growth numbers look clean. The reality is that three things are actively making delivery harder and all three are getting worse before they get better.
Getting power takes too long. In most major markets, connecting a new data center to the grid now takes four years or more. Some US grid operators have stopped accepting new connections entirely because the system can’t absorb any more load right now. This is not a temporary problem it’s the result of decades of underinvestment in power infrastructure, now colliding with the fastest-growing power demand any sector has ever produced.
Equipment is backordered. Lead times for key data center components have stretched to about 33 weeks on average up 50% from before 2020. Developers are ordering materials almost two years before they need them. Despite that, more than half of all data center projects in 2025 still experienced delays of three months or more.
It costs more to build. In 2020, the average cost to build one megawatt of data center capacity was $7.7 million. By 2025 it was $10.7 million a 39% increase. That’s not general inflation. It’s because what’s being built now is fundamentally more complex than what was built five years ago. More on that in the next piece.
All three figures: JLL 2026 Global Data Center Outlook
“The markets that win the next phase of this build are not the ones with the most money. They’re the ones that can answer three questions first: where’s the power, who has the land, and how fast can permits move?”
The number that made me stop and think
Here’s the thing that doesn’t get talked about enough. Global occupancy the share of data center space that’s leased is at 97%. 77% of everything currently under construction already has a tenant committed. By the numbers, this looks like a market with no slack at all.
And yet the average server inside those data centers is running at somewhere between 12% and 18% of its capacity. Around 10 million servers are sitting completely idle right now roughly $30 billion in hardware that’s plugged in, drawing power, and doing almost nothing.
What looks good
The leasing numbers
97% of space is leased. 77% of new builds already have tenants. Rents rising. No sign of oversupply by any real estate measure.
What raises a question
The utilisation numbers
Servers running at 12–18% of capacity. Around 10 million idle servers. $30 billion in hardware doing almost nothing. Overall utilisation across all data centers: roughly 59%.
Occupancy and pipeline: JLL 2026. Server utilisation: Lawrence Berkeley National Lab 2024 US Data Center Energy Usage Report. Idle servers / stranded capital: Fortune Aug 2025. Note: utilisation figures are modelled estimates — the industry does not require public disclosure of actual utilisation data.
These two things can both be true at the same time. Space being leased doesn’t mean the servers inside it are busy. What it means is that companies are securing capacity ahead of the demand they expect particularly from AI at scale, which is still building up. The space is committed. The workloads are coming. They’re just not all there yet.
I don’t think this makes the build irrational. But I do think it’s worth being honest about: the industry is building ahead of where demand actually sits right now. That gap will close but probably more slowly than most people assume.
One more thing worth flagging: nobody publishes verified utilisation numbers. The 12–18% figure comes from modelled estimates, not audited data. The industry doesn’t require that kind of disclosure.
Next on DC Decoded: why rack density not just raw demand is what’s actually driving the power constraint. And what it means that most data centers built five years ago can’t handle today’s AI infrastructure without a near-total rebuild. That piece goes up on LinkedIn and here on Substack. Follow along if you want to keep going deeper.